Reports and Resources
Convincing decision makers to prioritize people who bike and walk requires two things: great stories and great data. Our reports offer important, easy to understand case studies for both.
As the premier resource for advocates and policy makers on how to make biking better, the League has produced scores of reports and fact sheets over the years to make the case for building a Bicycle Friendly America for everyone.
In addition to our most recent reports, the League also hosts archives and resources created over the years through our work and that of our partners.
Can't find a report you're searching for? Contact us.
Recent Posts from our Research Team
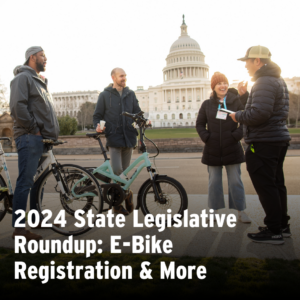
2024 State Legislative Roundup: E-Bike Registration & More
We’re four months into 2024, and most state legislatures across the country are in session deciding the laws and funding allocations that will shape life in each respective state. The…
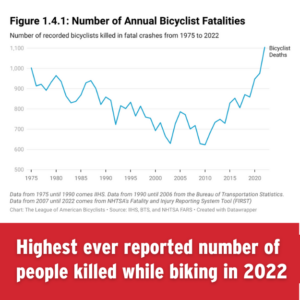
Highest ever reported number of people killed while biking in 2022
The tragedy of people being killed while biking continues to increase. This, despite the multitudes of federal, state, and local agencies saying they are dedicated to eradicating roadway deaths. Our…
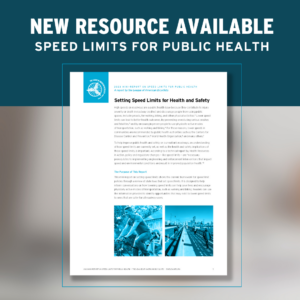
New Resource: Setting Speed Limits for Health and Safety
It’s National Public Health Week and the League of American Bicyclists is proud to celebrate with a new resource, “Setting Speed Limits for Health and Safety.“ Public health is the…
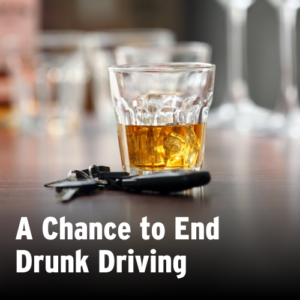
A Chance to End Drunk Driving
The 2021 Bipartisan Infrastructure Investment and Jobs Act (IIJA) requires auto manufacturers to implement drunk driving prevention technology in new vehicles as early as 2026. It does so by directing…
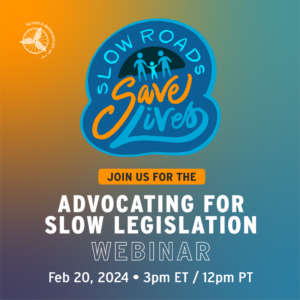
Webinar Recap: How Legislation Can Support Slow Roads
Last year, the League of American Bicyclists launched the Slow Roads Save Lives campaign. The campaign aims to create safer roads where people biking, walking, using mobility devices, and driving…
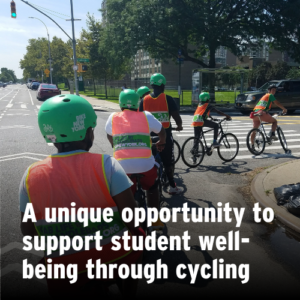
A unique opportunity to support student well-being through cycling
When many Americans think of their childhood, we may recall riding a bike, and the joy and freedom that came with it. While this may be a memory shared by…