DISCOVER YOUR LOCAL BICYCLING COMMUNITY
Find local advocacy groups, bike shops, instructors, clubs, classes and more!
Bicycle Friendly Community Attitudes and Behaviors
Attitudes and Behaviors of people in Bicycle Friendly Communities
In the last Bicycle Friendly Community round we offered a survey that communities could choose to distribute to the public. This survey was modeled after selected questions from the 2012 National Survey of Bicyclist and Pedestrian Attitudes and Behavior by the National Highway Traffic Safety Administration (NHTSA). The NHTSA survey was administered to a probability-based sample of randomly selected people 16 and older. The field interviewing began July 12, 2012, and concluded November 18, 2012. A total of 7,509 respondents completed the interview, 5,297 using a landline telephone when responding and 2,212 using a cell phone. NHTSA weighted the to produce national estimates.
Our survey was distributed by communities that applied for Bicycle Friendly Community recognition as they saw fit, including social media. Most communities took advantage of the voluntary survey to some extent, and 30% of communities had at least 100 responses to their survey. There were a total of 12,614 responses from 11,524 unique IP addresses and 122 of the 140 communities that applied. The data reported below is from all communities that applied for recognition in our Fall 2016 round and includes communities that did not receive a Bicycle Friendly Community award. A copy of the overall results is available here.
Who responded to our survey of Bicycle Friendly Community applicant communities?
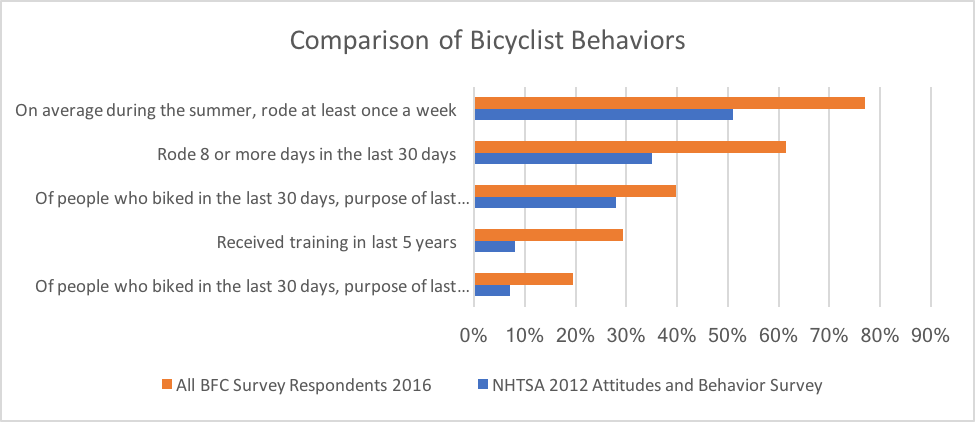
Our survey was designed to gather data on the behavior of people answering the survey and on respondents’ impressions of their communities. In general, the people who answered the survey were much more likely to be regular bicyclists, much more likely to have received training on bicycling safety in the past five years, and much more likely to commute by bike than the sample from the NHTSA survey.
Impressions of people in Bicycle Friendly Community applicant communities
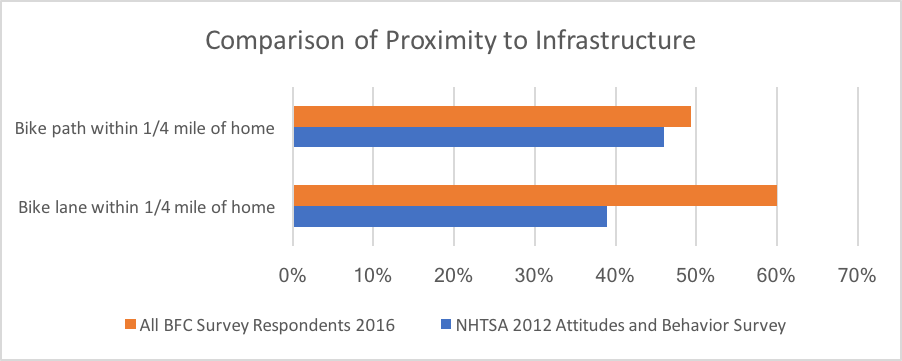
People in communities that applied for BFC recognition were more likely to report that they lived within a quarter mile of bicycle infrastructure.
But, they were also less likely to say that it is safe to ride in their neighborhood and more likely to say that “it depends” on conditions or that it is dangerous to ride in their neighborhood.
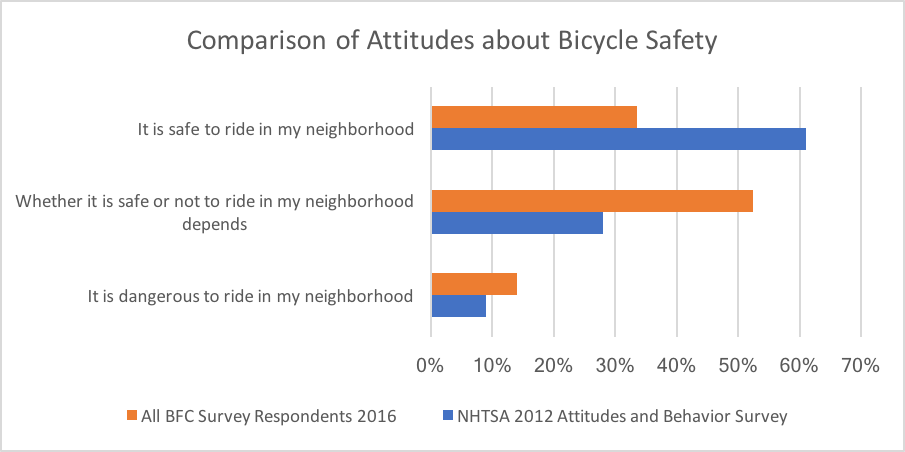
Several explanations for this apparent paradox seem possible:
- Perhaps bicyclists who ride more and are more educated about bicycle safety tend to view safety as more of a spectrum
- People who rode the most were most likely to pick “it depends” (~49% of the people who road 20-30 days of the last 30 days said “it depends”)
- People who had received training were most likely to say that their neighborhood is safe (~34%)
- Perhaps bicyclists who ride more and are more educated about bicycle safety have higher standards of safety
- However, people who rode the least or not at all were most likely to say that their neighborhood was dangerous (~21% of people who said they never rode said their neighborhood was dangerous, ~14% of people who rode once a summer or at least once a month said that their neighborhood was dangerous, and ~12% of people who rode at least once a week said their neighborhood was dangerous)
- Perhaps bicyclists who ride more and are more educated about bicycle safety are more likely to see bicycle infrastructure as insufficient on its own to create a safe environment
- However, people who lived within ¼ mile of a bike path were much more likely to say that their neighborhood was safe (42% of people who lived within ¼ mile of a bike path said their neighborhood was safe compare to 24% of people who did not live within ¼ mile of a bike path)
- However, people who lived within ¼ mile of a bike lane were also more likely to say that their neighborhood was safe (38% of people who lived within ¼ mile of a bike lane said their neighborhood was safe compared to 26% of people who did not live within ¼ mile of a bike lane)
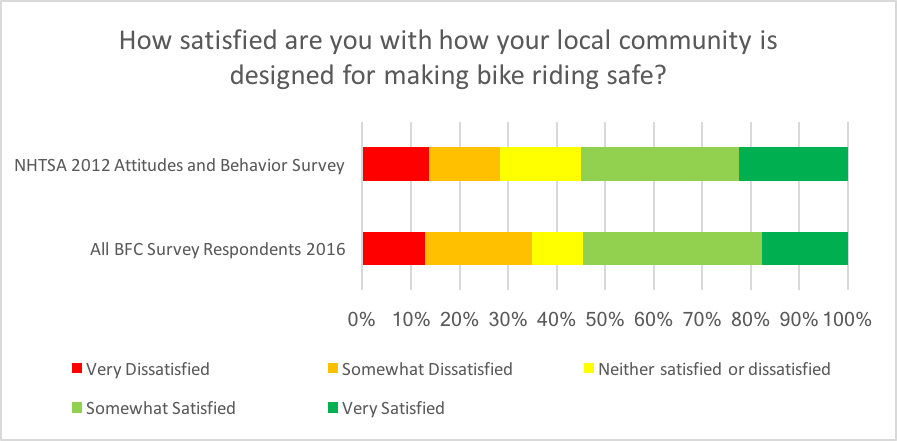
Overall, the people who answered our public survey were more opinionated about their community than people who responded to the NHTSA survey, with fewer people saying that they were “neither satisfied nor dissatisfied.” However, people who responded to the survey were actually less likely to choose the extreme options of being “very satisfied” or “very dissatisfied.” So, as with the question about safety above, survey respondents were much more likely to express an opinion that recognized that there is a great level of complexity in judging whether a community is a good place to bike.
- Unsurprisingly, 75% of people who said that their neighborhood was dangerous were somewhat or very dissatisfied with how their community is designed for making bike riding safe.
- Perhaps surprisingly, around 11% of people who said that their neighborhood was safe were also somewhat or very dissatisfied with how their community is designed for making bike riding safe.
Changes people would like to see in their communities
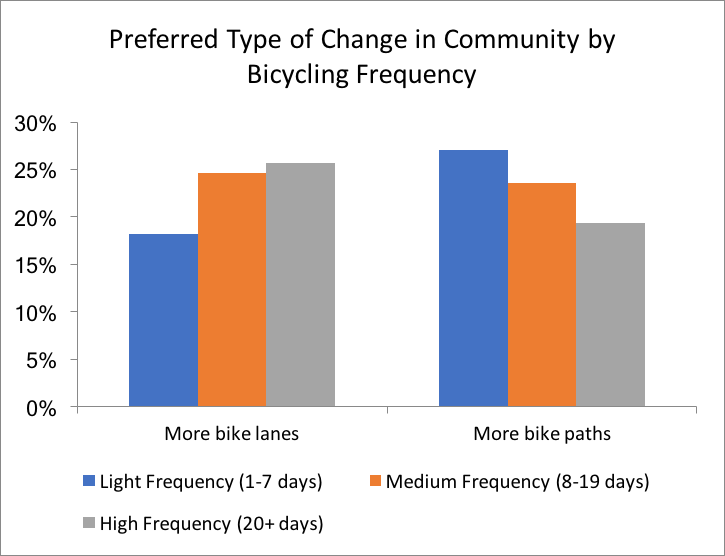
When asked about changes that people would like in their community, people who responded to the public survey broadly mirrored the preferences of the 2012 NHTSA Attitudes and Behavior Survey, with “more bike lanes” and “more bike paths” receiving by far the most support compared to the 12 possible changes that people could choose. As in the NHTSA Survey, people who biked most often were more likely to prefer “more bike lanes” and less likely to prefer “more bike paths.”
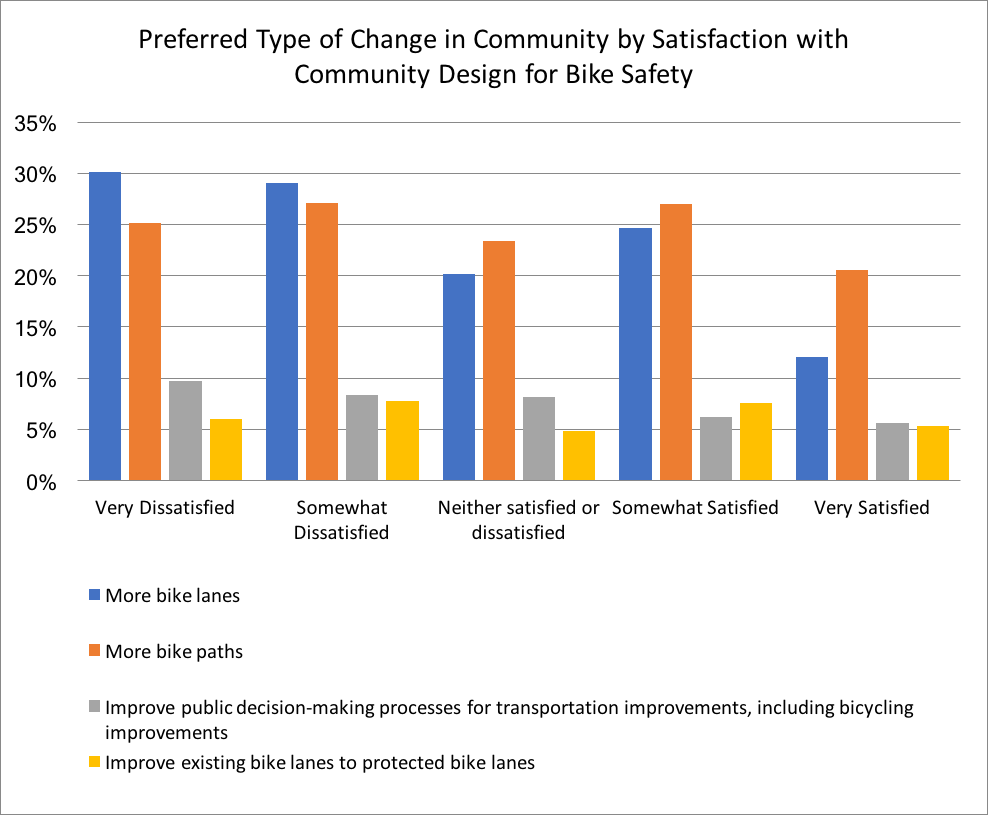
There were also some interesting differences in the preferred changes that people would like to see based upon satisfaction with the community’s design for bike safety. The chart below shows the four types of changes most often ranked as a person’s first preference for a change in their community. There were 12 types of changes (including no change/blank) that could be ranked.
People who were very or somewhat dissatisfied were more likely to express a preference for either “more bike lanes” or “more bike paths” than people who were somewhat or very satisfied. People who were very satisfied were more likely to leave this question blank or answer with “no change” and more likely to choose enforcement and education-related changes.
Perhaps notably, people in most categories chose improvements to public decision-making processes for transportation improvements over improving existing bike lanes to protected bike lanes. This could point to people broadly supporting more infrastructure, as seen in the two most common chosen preferences, but not believing that improvements to existing corridors are as effective as improvements to the network as a whole.
People, who do not bike want more enforcement against bicyclists
It was incredibly interesting to see a divergence between people who bike and people who don’t bike in the changes they would like to see. Our survey provides some insight into why there can be animosity between people who bike and people who don’t bike, with these groups seeing behaviors and how to change behaviors differently.
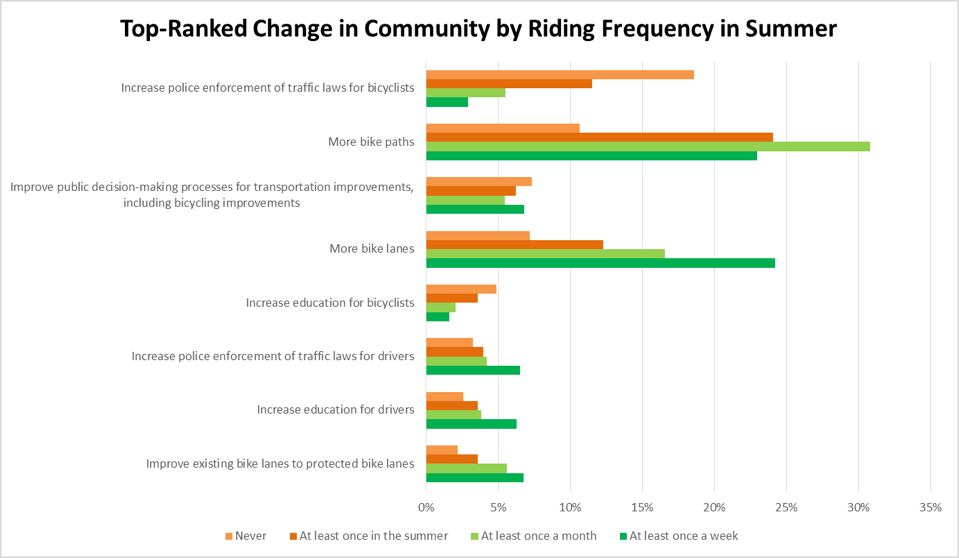
- Notably, people who never rode a bicycle were much more likely to say that the change they would like to see in their community was more police enforcement of traffic laws for bicyclists, choosing that options more often than any other option (other than not answering the question).
- People who rode less than once a month were also much more likely to choose increased enforcement of traffic laws for bicyclists (it was the top choice for 11.5% of people who rode at least once in the summer), but this group also chose “more bike paths” and “more bike lanes” more often than increased enforcement.
The League has long believed in the importance of educating people to be safe and responsible bicyclists. This data points to the importance of education and proper bicyclist behavior for addressing the concerns of people who do not bike. It should be noted that people who answered that they never biked during the summer were 6% of the NHTSA survey sample and less than 5% of our survey sample.
A strong start for better public input in the Bicycle Friendly Community program
It was great to have such a large response to our first BFC public survey. By incorporating public surveys, and other metrics that can be clearly reported over time, the Bicycle Friendly Community program is leveraging the extraordinary efforts that communities put into the program. While our survey has many notable limitations, including a lack of demographic data, over time it should provide a robust data set that gives insight into opinionated and educated bicyclists as well as the general public. This data will also be helpful to understand the effectiveness of the Bicycle Friendly Community awards and areas for their improvement.