Blog
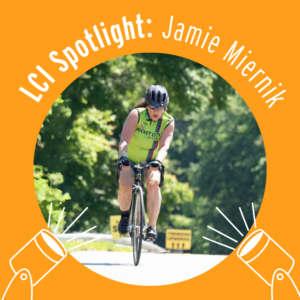
The League certifies hundreds of League Cycling Instructors every year and there are thousands of LCIs across the country leading bike education efforts in their communities. In our LCI spotlight…
Read More →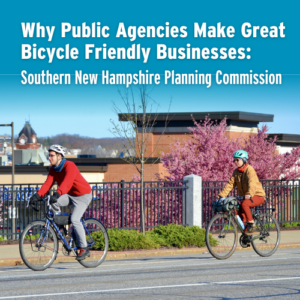
Communities and organizations often use the League’s Bicycle Friendly America program as a way to set local benchmarks and receive actionable feedback around bicycling improvements they could make for everyone’s…
Read More →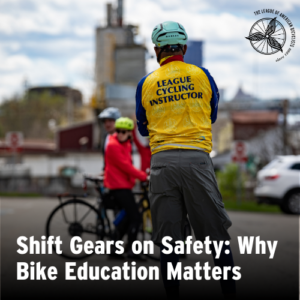
You’ve probably heard it before: “oh, I couldn’t bike here, it’s too [fill in your town’s biggest barrier to biking.]” Hesitations about safety or about skills aren’t uncommon. Cycling can…
Read More →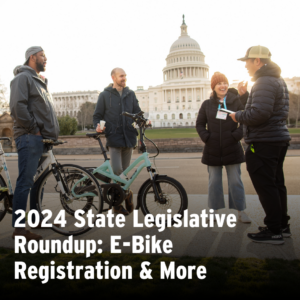
We’re four months into 2024, and most state legislatures across the country are in session deciding the laws and funding allocations that will shape life in each respective state. The…
Read More →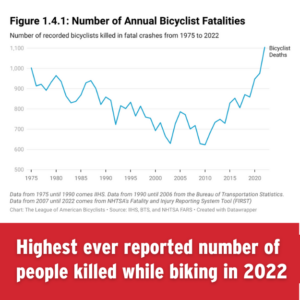
The tragedy of people being killed while biking continues to increase. This, despite the multitudes of federal, state, and local agencies saying they are dedicated to eradicating roadway deaths. Our…
Read More →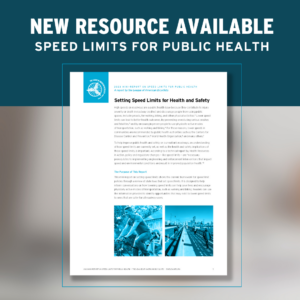
It’s National Public Health Week and the League of American Bicyclists is proud to celebrate with a new resource, “Setting Speed Limits for Health and Safety.“ Public health is the…
Read More →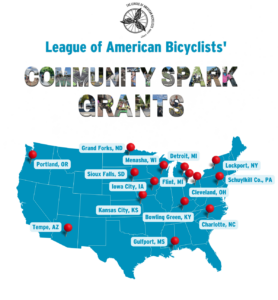
Today, the League of American Bicyclists is thrilled to announce the recipients of our 2024 Community Spark Grants! After extensive review, the League selected 15 communities to each receive $1,500…
Read More →
In honor of Women’s History Month, we’re celebrating women who are currently shaping cycling history. One such figure is Austin Killips, who holds the title of being “the first transgender…
Read More →For the first time since 2019, we were thrilled to host our annual Advocacy and Education Awards ceremony in person at this year’s Summit. There is something just particularly special…
Read More →
It’s no secret that the power of the bicycle is transformative. Communities nationwide are taking innovative approaches to spark local change for better bicycling, and seeing incredible results. This is…
Read More →